Written by Jolene Goh, Nigel Chou, Maurice Lee & Kok Hao Chen
In tissue, every cell has a unique identity. Each of them expresses thousands of different genes at different levels, resulting in different numbers of RNA transcripts for each gene. We call this the ‘transcriptome’ of a cell. One suite of tools to study the transcriptome is known as Multiplexed Fluorescence In Situ Hybridization (FISH). With Multiplexed FISH, we are able to image and quantify hundreds of different RNA species in tissue samples. In addition, because we are using a fluorescence microscope to detect each cell at their native locations within the tissue, we are able to chart out a detailed map of where the cells are relative to each other — hence the term ‘spatial transcriptomics’.
To imagine what this looks like, think about taking the local subway train or, as we call it in Singapore, the mass rapid transit (MRT). Every train station has a different name and is located in a different place. Stations that are ‘closely linked’ to each other would be on the same train line (Figure 1). You could travel down just one train line and learn a little more about each train station. This is somewhat analogous to studying just one specific cell type and the different variations within this one cell type.

However, if we want a better, fuller, and more accurate picture of the train network, we would need to place the different train lines (or cell types) with reference to each other spatially (Figure 2). Now, with the improved map, we can see how the train lines interact with each other, which train stations have special functions as interchanges that connect different train lines, and how the different train lines work together as an interconnected network to perform their function of connecting the entire city of Singapore.

Now imagine being able to look at the transcriptome of every single cell in a tissue sample as a 2D or 3D information-rich map with subcellular resolution. At first glance, we can visualize where different subtypes of cells exist in relation to one another. But with further analysis, we can zoom in to see distribution patterns of the transcriptome, better understand gene regulatory networks together with local cellular interactions, even predict functions for genes with previously unknown functions, reconstruct cell lineage trajectories (transcriptionally and spatially), and even more!
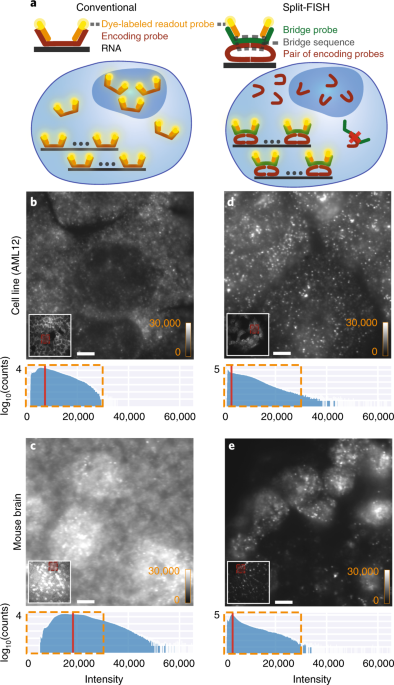
In an ideal world, all of this sounds pretty great. Unfortunately, when we apply Multiplexed FISH to tissue samples, we often do not obtain a picture as clean as the subway map. When we perform the Multiplexed FISH protocol, we use very concentrated probe solutions with thousands of different DNA probes. This means that off-target binding of the FISH probes is bound (pun intended) to happen. This raises the noise floor and often generates spurious signals that are false positives (imagine false stations popping up on the MRT map, how confusing for the commuters!). To get around these problems, one might use tissue clearing approaches to remove unwanted proteins and lipids, which will reduce non-specific binding of probes to these cellular components. However, clearing protocols are often laborious. They also create an additional source of technical variability between samples and may need to be customized for each tissue type. In addition, it does not solve the issue of spurious signals coming from non-target RNAs in a sample. Hence, we have developed an alternative approach that directly enhances the probe’s specificity to target RNAs, and can also be applied to a variety of tissue types with minimal customization.
The Idea
We were inspired by the idea of split fluorescent proteins. Split fluorescent proteins are made up of two complementary fragments that are not fluorescent when they are apart. However, when they are brought together, they gain the ability to fluoresce.
This inspired us to develop a labeling scheme (Figure 3) with similar capabilities using a pair of oligonucleotide probes—providing off-target rejection when just one of the two probes in a pair bind non-specifically. However, if both probes bind to adjoining regions of a target RNA, it will lead to a fluorescent signal.

The Process
We started with a question of ‘what is the optimal bridge sequence length and geometry?’ We wanted to achieve the best signal-to-noise ratio and still have good off-target rejection . We discovered the optimal length of the bridge sequences, and while testing various split geometries, which we named ‘circular’, ‘cruciform’, ‘double C’, ‘double Z’ (see Figure 4 for diagrams), we observed that the version with the best brightness and specificity was the ‘circular’ configuration. Surprisingly, the circular configuration performed better in this respect than previously reported split configurations such as the ‘double Z’ (used in RNAscope) or the ‘cruciform’ (used in HCR3.0).

Figure 4. Diagrams of various split geometries. (g) Circular construct. (h) Cruciform construct. (i) Double C construct. (j) Double Z construct. (k) Conventional construct. (l) Unpaired construct
In addition, the circular configuration produced RNA signals of comparable brightness to the conventional design, meaning that we did not have to sacrifice signal quality to achieve better specificity. We think that the simplicity of the circular design may be causing less steric hindrance, allowing the bridge sequence to bind to the split-probes more efficiently.
However, we were met with more road bumps along the way when applying this design to Multiplexed FISH. We knew that to use split-probes for Multiplexed FISH, we would need a set of many unique bridge sequences to use as ‘barcodes’ for repeated rounds of hybridization and washing during the multiplexing process. Initially, we designed the bridge sequences based on common rules for probe design, ensuring that they avoided secondary structure formation and had optimal melting temperature. However, we quickly discovered that different bridge sequences could still have widely varying RNA spot brightness—implying varying binding efficiencies or kinetics across these sequences. This meant that beyond the known rules of probe design, there were further constraints we needed to uncover to refine the probe design. We screened through many sequences and one particular bridge sequence came up on top, as it was able to bind strongly within 10 min of hybridization and wash off cleanly. From there, we decided to use this sequence as the backbone and made small changes to it by mutating 6 bases on it to create new barcodes. With these optimized sequences, we were able to perform 26 rounds of hybridization and washing without any observable loss of FISH signal or RNA counts. This finally allowed us to adapt the split-probe approach to Multiplexed FISH!
The Cellular MRT map
We applied this technique, which we call split-FISH, to accurately profile the transcriptome of single cells in uncleared tissues. To show the broad applicability of this technique, we probed a set of 317 genes in 4 types of mouse tissue (brain, kidney, ovary, and liver). We also quantified their distribution and abundance of the genes to reveal diverse localization patterns (Figure 5). We hope that this technique will lower the barrier to adoption of Multiplexed FISH assays in tissue, and that the data obtained from such assays will offer a wealth of new insights into intercellular interactions and disease mechanisms.

![]()


Please sign in or register for FREE
If you are a registered user on Research Communities by Springer Nature, please sign in